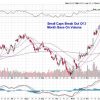
The current state of the stock market has investors on edge, closely watching for any signs of a shift in the bullish momentum that has been driving markets for quite some time. While predicting the exact moment when this momentum will snap is challenging, analyzing key charts and indicators can offer valuable insights into understanding market dynamics.
One chart that investors should pay close attention to is the S&P 500 Index. This index, which comprises large-cap U.S. stocks, is often seen as a bellwether for the overall stock market performance. By analyzing the trend of the S&P 500 through technical analysis tools such as moving averages and support/resistance levels, investors can gauge the strength of the current bullish momentum. Any significant breaks below key support levels could indicate a weakening trend and potential reversal in market sentiment.
Another important chart to watch is the Volatility Index (VIX), also known as the fear index. The VIX measures market volatility and is often used as a proxy for investor sentiment. A rising VIX typically signals increasing market uncertainty and fear, which can precede market corrections or downturns. Investors should monitor the VIX closely alongside stock market movements to get a sense of market participants’ emotions and risk appetite.
In addition to traditional charts and indicators, monitoring market breadth can provide valuable insights into the health of the overall market. Market breadth indicators, such as the Advance-Decline Line or the percentage of stocks above their 200-day moving average, can help investors identify divergence between the performance of the broad market and individual stocks. Divergence in market breadth could signal internal weakness in the market, indicating a potential shift in sentiment.
Furthermore, keeping an eye on sector rotation can offer clues about the sustainability of the current bullish momentum. Certain sectors, such as technology or consumer discretionary, have been leading the market higher in recent years. Observing how different sectors perform relative to each other can highlight shifts in investor preferences and provide valuable insights into market trends. Rotation out of leading sectors and into defensive sectors like utilities or consumer staples could indicate a shift towards a more risk-off sentiment.
Ultimately, predicting the exact moment when the stock market’s bullish momentum will snap is an intricate and complex task. By analyzing key charts and indicators, investors can better position themselves to anticipate potential market shifts and adjust their investment strategies accordingly. Staying vigilant, informed, and adaptable in response to evolving market conditions is crucial for navigating the uncertainties of the stock market.


