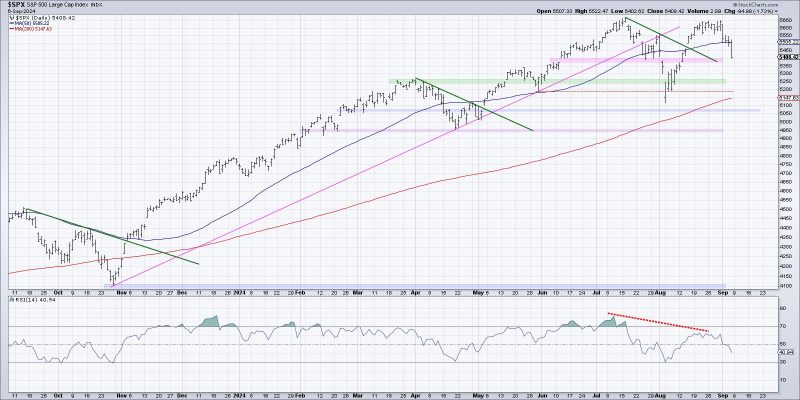
As the global financial markets continue to exhibit heightened volatility amid economic uncertainties, investors are turning to charts to gain insight into potential market tops. By analyzing key indicators and patterns, traders can identify signals that may indicate a potential downturn in the market. Three essential charts that are currently screaming market top are the Hindenburg Omen, the NYSE Bullish Percent Index, and the Advance-Decline Line.
The Hindenburg Omen, a technical analysis pattern named after the famous German airship disaster, is a warning signal that occurs when a large number of stocks simultaneously hit new highs and new lows. When this pattern emerges, it suggests that the market may be on the verge of a sharp decline. Investors are advised to take note of the Hindenburg Omen as it has historically preceded significant market downturns.
Another crucial chart to watch is the NYSE Bullish Percent Index, which tracks the percentage of stocks on the New York Stock Exchange that are currently exhibiting bullish price patterns. A high Bullish Percent Index reading indicates that a large portion of stocks are in strong upward trends, potentially signaling market exuberance and a looming correction. Conversely, a low reading may suggest impending market weakness.
The Advance-Decline Line, a measure of market breadth, tracks the number of advancing stocks versus declining stocks over a given period. A healthy market typically sees a strong advance-decline line, indicating broad participation in the market rally. However, a divergence between the stock market index and the advance-decline line could be a warning sign of a market top. If the market index continues to rise while the advance-decline line stagnates or declines, it may indicate that the rally is losing momentum and a correction could be imminent.
In conclusion, market participants should be vigilant and attentive to potential signals of a market top as highlighted by various key charts such as the Hindenburg Omen, NYSE Bullish Percent Index, and the Advance-Decline Line. By monitoring these indicators closely and staying informed about market conditions, investors can better position themselves to navigate turbulent market cycles and protect their portfolios from potential downturns.


