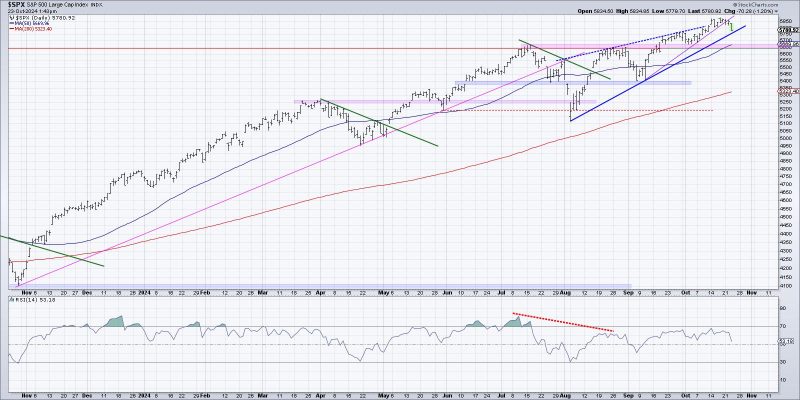
Three Ways to Visualize the Start of a Potential Distribution Phase
Method 1: Volume Analysis
One of the key ways to identify the start of a potential distribution phase is through volume analysis. Volume can provide crucial insights into market sentiment and the trading activities of investors. During a distribution phase, you may notice a decrease in trading volume compared to previous trends. This decline in volume indicates that fewer market participants are actively buying or selling the asset. As supply and demand become imbalanced, it can be a sign that accumulation or distribution is taking place. By comparing volume levels during different market phases, you can observe if there is a significant drop-off in trading activity, signaling the beginning of a distribution phase.
Method 2: Price Action Patterns
Price action patterns offer another valuable tool for visualizing the start of a potential distribution phase. As market participants engage in distribution, you may observe specific price patterns emerging on the chart. One common pattern to watch for is the topping pattern, characterized by a series of higher highs followed by lower highs as the asset’s price reaches a peak before a potential reversal. Other patterns such as head and shoulders, double tops, or rising wedges can also indicate a distribution phase is underway. By recognizing these patterns early on, traders can prepare for a potential shift in market direction and adjust their trading strategies accordingly.
Method 3: Moving Averages
Utilizing moving averages can also help traders identify the beginning of a distribution phase. Moving averages smooth out price data over a specified period, providing a clearer picture of the underlying trend. During a distribution phase, you may notice that the price of the asset starts to trade below key moving averages, such as the 50-day or 200-day moving average. This downward trend can signal a shift in market sentiment from accumulation to distribution. Additionally, the crossing of short-term moving averages below long-term moving averages, known as a death cross, can further indicate a potential distribution phase. By monitoring moving averages and their crossovers, traders can track changes in market momentum and anticipate a change in the market trend.
In conclusion, visualizing the start of a potential distribution phase requires a combination of volume analysis, price action patterns, and moving averages. By incorporating these three methods into your technical analysis toolkit, you can better position yourself to identify early signs of distribution in the market. Recognizing these signals and being prepared for a shift in market dynamics can help traders navigate volatile market conditions and make informed trading decisions.


