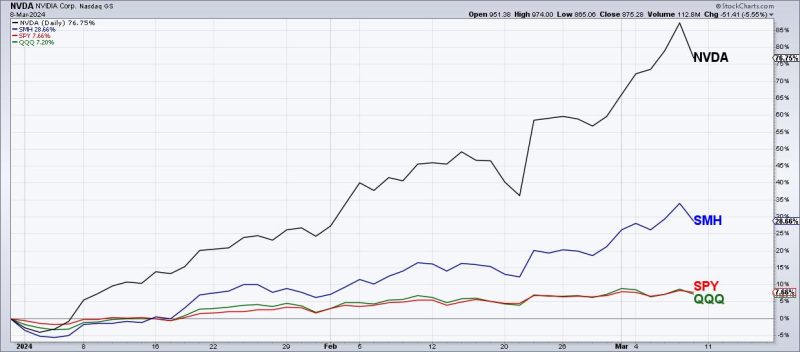
The bearish engulfing pattern, a technical analysis tool in stock trading, has been suggested to mark a potential top for NVIDIA Corporation (NVDA) shares. This pattern, characterized by a large down candlestick engulfing a prior up candlestick, is seen by some traders as an indicator of a potential reversal in the stock’s price trend. Understanding the implications of the bearish engulfing pattern can help investors make informed decisions regarding their NVDA holdings.
Technical analysis is a method of evaluating securities by analyzing statistics generated by market activity, such as past prices and volumes. It focuses on historical price movements and trading volume to predict future price movements. The bearish engulfing pattern is one of the many candlestick patterns used in technical analysis to signal potential changes in stock prices.
The formation of a bearish engulfing pattern typically involves an initial period of bullish market sentiment, represented by a small up candlestick. This is followed by a larger down candlestick that completely engulfs the prior up candlestick. The engulfing candlestick reflects a shift in market sentiment from bullish to bearish, suggesting that selling pressure may be increasing and that a potential reversal in price direction could be imminent.
For NVDA, the appearance of a bearish engulfing pattern could indicate that the stock’s recent upward momentum may be losing steam, and that a downward correction could be on the horizon. Investors who are considering buying or holding NVDA shares may want to exercise caution in light of this technical signal, as it suggests a potential change in the stock’s price trend.
It is important to note that while the bearish engulfing pattern can be a useful tool in technical analysis, it is not a foolproof indicator of future stock price movements. Market conditions are influenced by a multitude of factors, including economic data, company performance, and geopolitical events, which can all impact stock prices independently of technical patterns.
Traders and investors should use the bearish engulfing pattern, along with other technical indicators and fundamental analysis, to form a comprehensive view of a stock’s potential price direction. By integrating multiple sources of information, market participants can make more informed decisions and mitigate risk in their trading strategies.
In conclusion, the bearish engulfing pattern on NVDA shares could be signaling a potential top in the stock’s price trend. Understanding this technical indicator and its implications can help investors navigate the stock market more effectively and make better-informed investment decisions. While technical analysis is a valuable tool in evaluating stock performance, it should be used in conjunction with other analytical methods for a more comprehensive assessment of market conditions.


