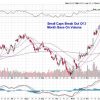
Market Breadth Indicators: Insight into Market Health
Market breadth, a key component of technical analysis, provides investors with valuable insights into the overall health of the market. By analyzing market breadth indicators, traders can gauge the level of participation and strength behind market movements, helping them make more informed investment decisions. In this article, we delve into three important market breadth indicators that investors should watch to gain a better understanding of market dynamics.
1. Advance-Decline Line (A/D Line)
The Advance-Decline Line is a simple yet powerful indicator that tracks the number of advancing and declining stocks in a given market. By comparing the number of stocks rising in price (advancing) versus those falling (declining), the A/D line provides a broader perspective on market performance beyond just the major indices. A rising A/D line indicates broad-based strength in the market, while a declining A/D line suggests weakness. Traders often use the A/D line to confirm the direction of the market trend and to identify potential reversals.
2. New Highs-New Lows
The New Highs-New Lows indicator measures the number of stocks hitting new 52-week highs versus those making new 52-week lows. This indicator helps investors assess the breadth of market strength or weakness. When the number of stocks hitting new highs exceeds those making new lows, it suggests a healthy market environment with strong momentum. Conversely, an increasing number of new lows relative to new highs may signal deteriorating market breadth and potential downside risk. Monitoring the New Highs-New Lows indicator provides valuable insights into the underlying strength of the market trend.
3. McClellan Oscillator
The McClellan Oscillator, developed by Sherman and Marian McClellan, is a market breadth indicator based on the difference between advancing and declining issues. This oscillator provides a more refined view of market breadth dynamics by smoothing out short-term fluctuations. The McClellan Oscillator oscillates around a zero line, with positive values indicating bullish market breadth and negative values suggesting bearish breadth. Traders often use the McClellan Oscillator to identify overbought or oversold conditions in the market, offering potential trading opportunities.
In conclusion, market breadth indicators play a crucial role in helping investors assess the underlying strength and direction of the market. By monitoring indicators such as the Advance-Decline Line, New Highs-New Lows, and McClellan Oscillator, traders can gain valuable insights into market dynamics beyond just price action. Incorporating market breadth analysis into their trading strategy can enhance decision-making and improve overall performance in the financial markets.


